


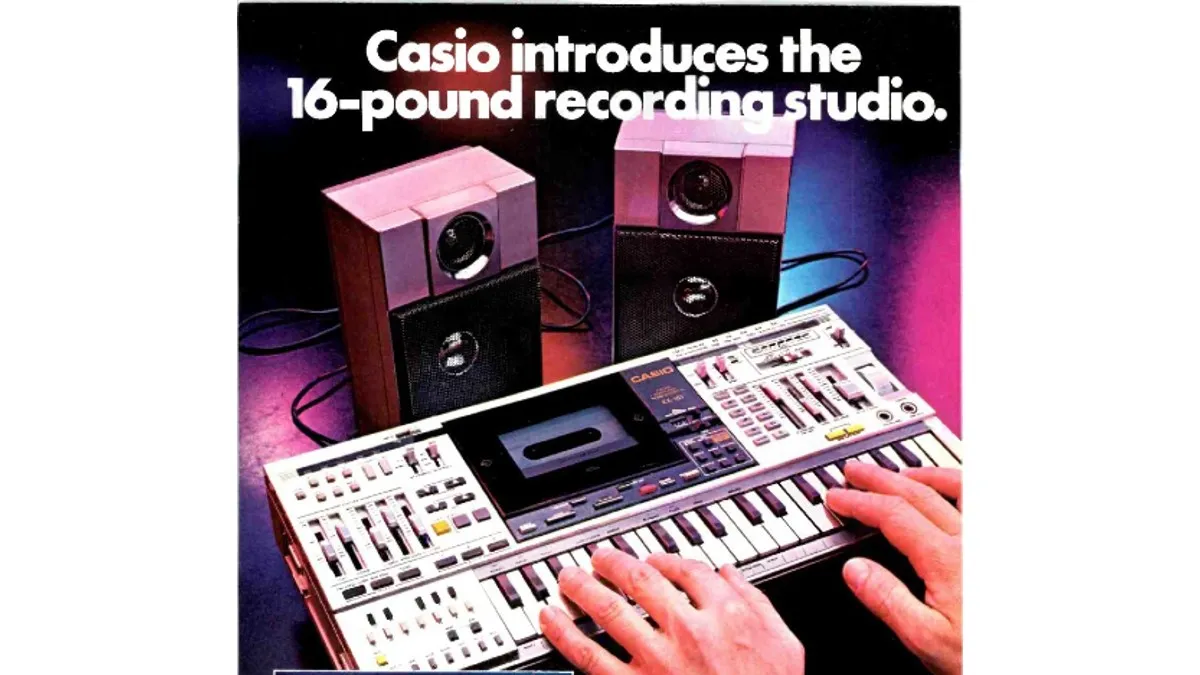
Is Casio's 'recording studio in a boombox' the most bizarre music-making product of all time?
Synth workstation? Karaoke machine? Recording studio in a ghetto blaster? Answer: all - and none - of the above…
Synth workstation? Karaoke machine? Recording studio in a ghetto blaster? Answer: all - and none - of the above…

For our latest free sample pack, we ran a variety of loops and one-shots through the Casio SK-1, Akai S900 and Bugbrand BugCrusher
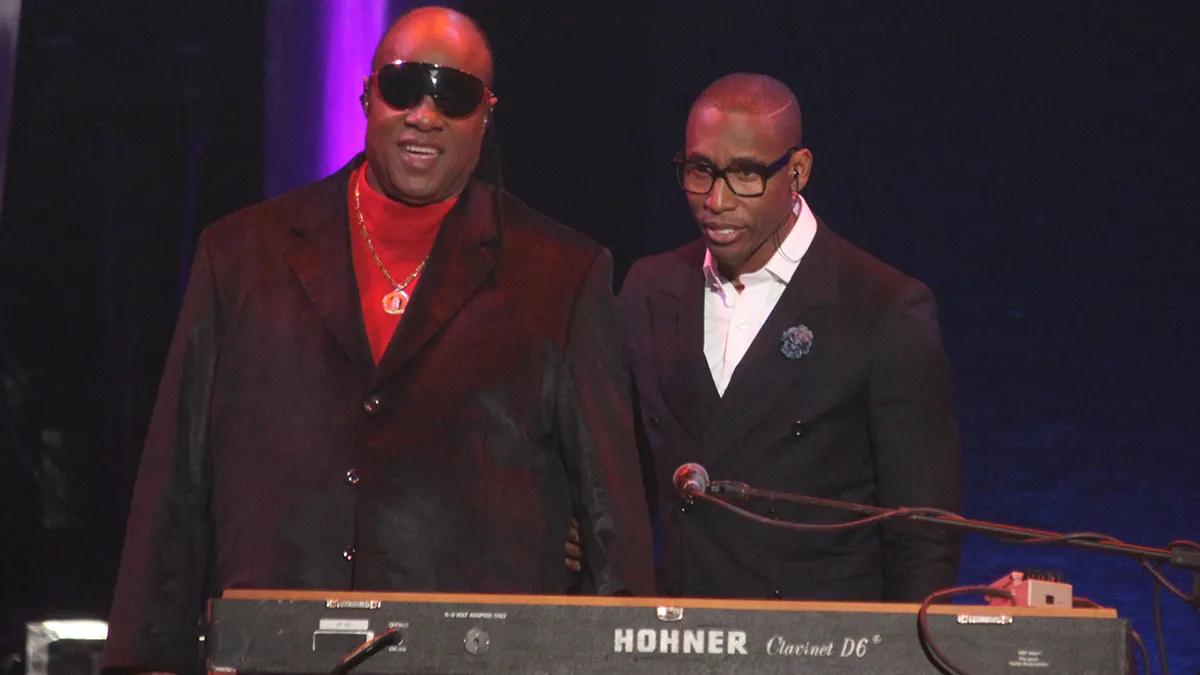
“I guess we were sort of playing a game to see who could get the furthest behind without getting off beat,” says Saadiq of the recording of D’Angelo’s Lady

One of the world’s most popular studio microphones gets back to basics. We find out more

Do think twice, it’s the wrong mic

Is this your new best case scenario? We find out

“I brought this weird Roland monosynth upstairs. It was an early ’70s primitive synth and we were bugging out over it”

The late composer might have been known for his cutting-edge synth use, but he didn't agree with every studio breakthrough

Only one other producer has managed it

It seems that the streaming platform could be set to capitalise on the demand for multiple versions of viral hits
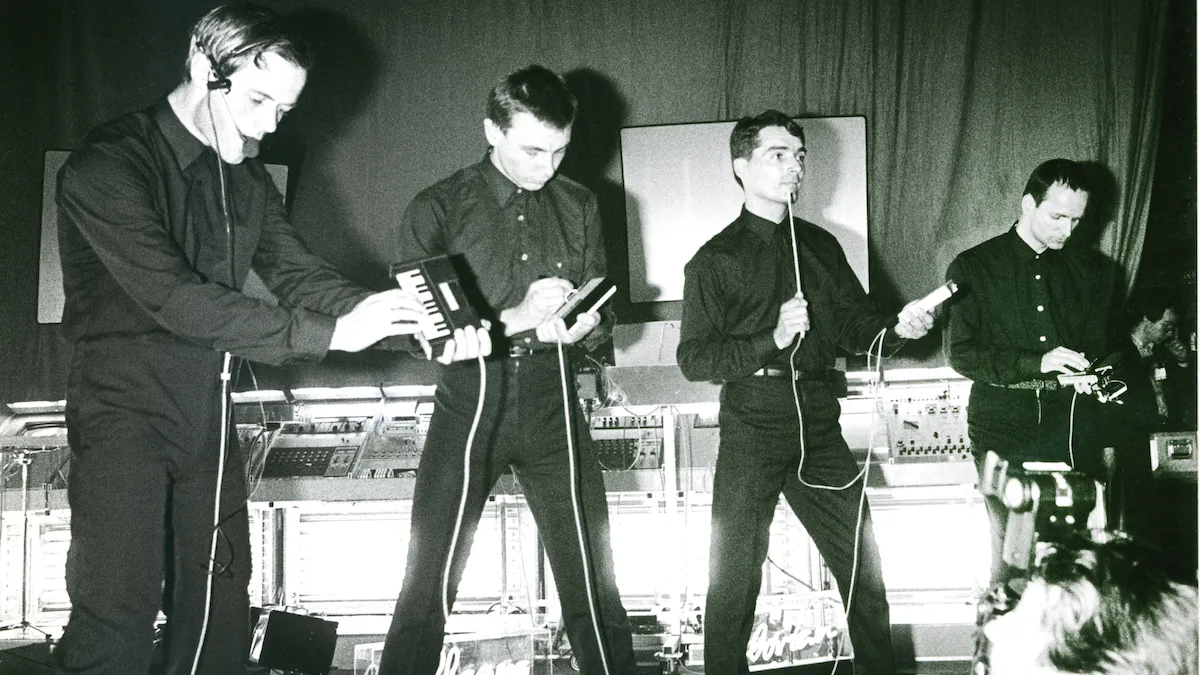
And it's certainly not the only piece of weird gear the iconic German band have used…

The DT-DX is based on the Raspberry Pi-powered MiniDexed DIY synth
An “accidental leak” was to blame, apparently

“Just don’t blame me - it’s not my fault,” she told the crowd. “Well, it’s partially my fault. But not entirely my fault”

Electronic artist, producer, gear explorer, film composer, and modular master Robin Rimbaud has been releasing music as Scanner and other acts for more than four decades. Here, he gives us a more electronic expert viewpoint on what separates a demo from the finished article…

This all-in-one room correction package means no more excuses for a muddy low-end
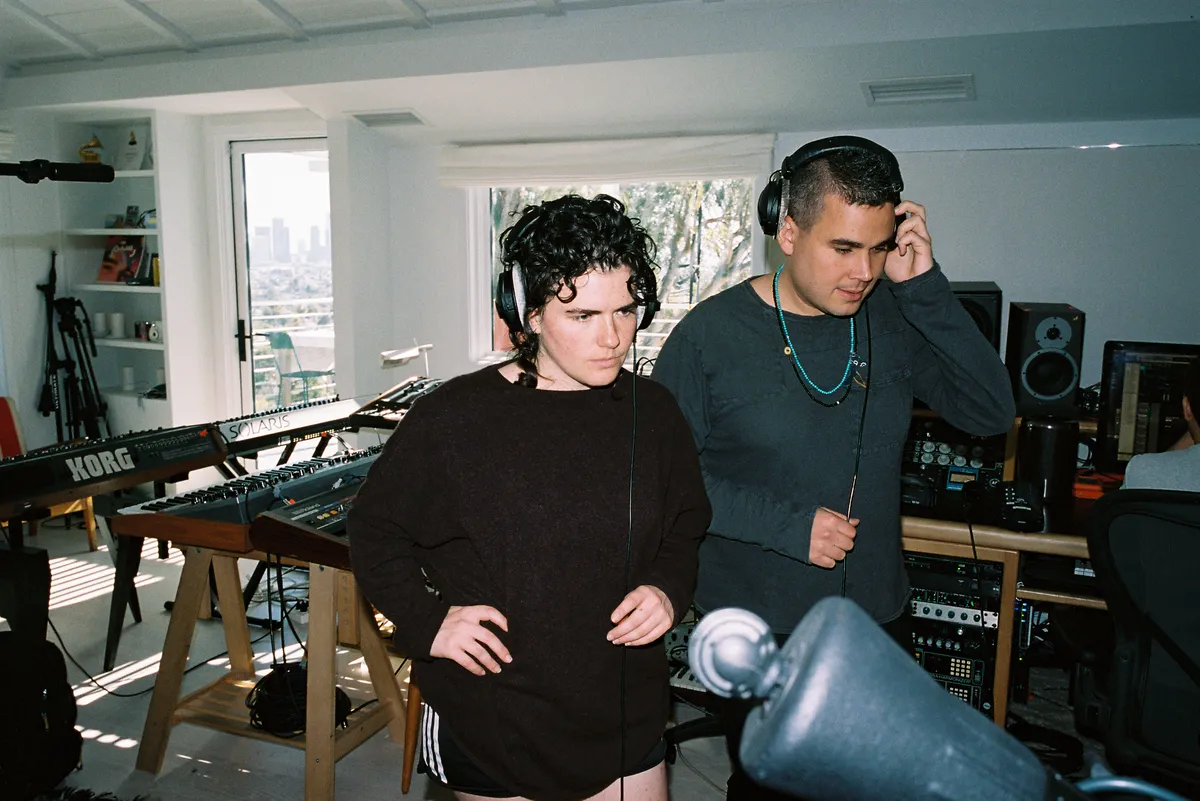
Solo artist, collaborator, songwriter, producer, remixer and drummer Georgia Barnes is also a self-confessed synth nerd, which she has every right to blame on her upbringing. Here she explains how she works within that electronic world with producers and artists including Rostam, William Orbit and Olly Alexander…

As their newest soundtrack collaboration, Challengers, gets set for release, the pair break down some of their most iconic work

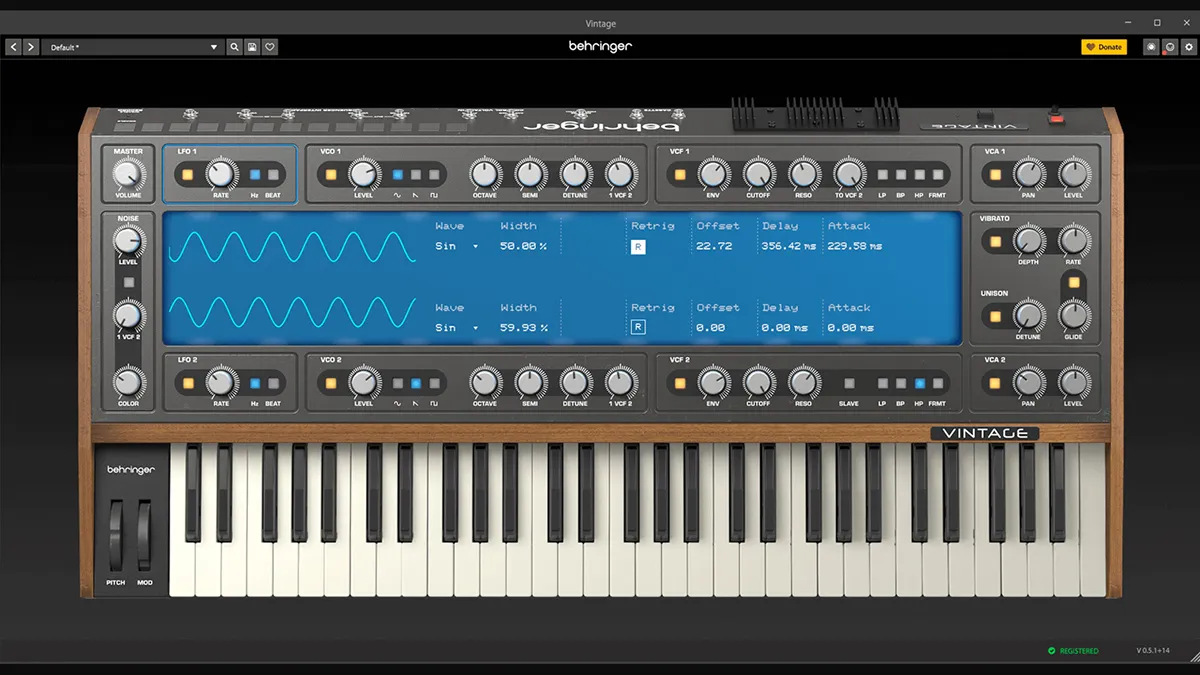
An iOS-based homage to a virtual analogue classic

